Space Weather Database in Japan
Observation (CAWSESDB-J-OB0051)
Version 1.0 March 2006
(CAWSES SPACE-W Database in Japan)
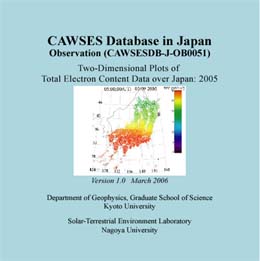
Two-Dimensional Plots of Total Electron Content Data over Japan
2005
OB0051
| CAWSES (Climate And Weather of the Sun-Earth System) Space Weather Database in Japan Observation (CAWSESDB-J-OB0051) Version 1.0 March 2006 (CAWSES SPACE-W Database in Japan) Two-Dimensional Plots of Total Electron Content Data over Japan 2005
|
OB0051 |
This CD-ROM contains two-dimensional plots of vertical Total Electron Content (TEC) data over Japan in 2005. The TEC data are derived from Global Positioning System (GPS) observation by GPS Earth Observation Network (GEONET) of Geographical Survey Institute, Japan.
1. Data
GEONET consists of about 1,200 dual-frequency GPS receivers. The dual frequency radio signals of the GPS allow measurements of the total number of electrons along ray paths from GPS satellites to receivers. TEC data are obtained in every 30 seconds for all of the satellite-receiver paths of GEONET [Saito et al., 1998]. To remove instrumental biases inherent in the GPS satellite and receiver and obtain absolute value of TEC, we used the method developed by Otsuka et al. [2002].
Two-dimensional distribution of TEC over Japan is determined by conversion of slant TEC to vertical TEC on an assumption of thin ionospheric layer, and average of data in a certain area. The spatial resolution of the two-dimensional TEC data of GEONET is 0.15 x 0.15 degrees in latitude and longitude, and temporal resolution is 30 seconds.
The TEC data is daily processed and stored by GPS-TEC database of Kyoto University. This GPS-TEC database has been developed in collaboration with Drs. Yuichi Otsuka and Takuya Tsugawa of the Solar-Terrestrial Environment Laboratory, Nagoya University.
2. Plots
In this CD, the absolute value of vertical TEC detected by GEONET are displayed in two-dimensional maps. The spatial resolution of the TEC maps is 0.15 x 0.15 degrees in latitude and longitude.
The maps were drawn for every 30 minutes. The maps are snap-shots of the vertical TEC at the instant, not the average for 30 minutes, though the data are derived in every 30 seconds.
There is an "index.html" file in the top directory/folder of CD. You can open it with any WWW browser. You can browse the GPS-TEC plots by clicking hyper-links in "index.html". The plots are saved in JPEG format.
Recent plots are available on the homepage of GPS-TEC database of Kyoto University. Its URL address is "http://stegps.kugi.kyoto-u.ac.jp/".
3. Notes
All the plotted data are just for browsing purpose and are not fully calibrated. Please do not use the plots at any presentations and publications without contacting the principal investigator, Akinori Saito (saitoua[AT]kugi.kyoto-u.ac.jp). Digital data are available on request.
Please contact the Principal Investigator to use the data and plots.
4. Contact address
Dr. Akinori Saito
Department of Geophysics, Graduate School of Science
Kyoto University
Kyoto 606-8502, Japan
TEL: +81-75-753-3954 FAX: +81-75-722-7884
E-mail: saitoua[AT]kugi.kyoto-u.ac.jp
5. Acknowledgments
We acknowledge Geographical Survey Institute, Japan for providing the GEONET data. GPS-TEC database of Kyoto University is supported by Japan Society of the Promotion of Science(JSPS) with a grant-in-aid for publication of scientific research results.
6. References
Otsuka, Y., T. Ogawa, A. Saito, T. Tsugawa, S. Fukao, and S. Miyazaki , A new technique for mapping of total electron content using GPS network in Japan, Earth, Planets, and Space, vol. 54, 63-70, 2002.
Saito, A., S. Fukao, and S. Miyazaki,
High resolution mapping of TEC perturbations with the GSI GPS network over Japan, Geophys. Res. Let., vol. 25, 3079-3082, 1998.