MHD Simulation of a Solar Flare Based on
Magnetic
Reconnection Model
Yokoyama, T. & Shibata, K.
National Astronomical Observatoy of Japan
Abstract
 Fig.1
Fig.1
Two-dimensional
simulation of a solar flare is performed using a newly developed
magnetohydrodynamic (MHD) code including nonlinear anisotropic heat conduction
effect (Fig.1). We also derived a simple scaling law for the flare temperature
described as T \propto B^{6/7} where T and B are the
temperature at the flare loop apex and the coronal magnetic field strength.
Introduction
 Fig.2
Fig.2 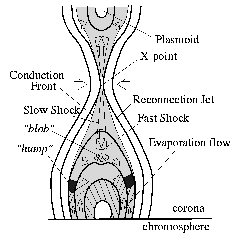 Fig.3
Fig.3
Fig.2 shows the soft X-ray
image of a cusp-shaped flare observed with Yohkoh soft X-ray telescope (Tsuneta
et al. 1992), and Fig. 3 shows the schematic picture of the magnetic
reconnection model of a flare. In this model, the energy released by the
reconnection is transported by heat conduction to the chromosphere, where the
so-called ``chromospheric evaporation'' (Neupert 1968), i. e. an ablation of
chromospheric plasma, occurs. In this study, we performed a two-dimensional MHD
simulation of chromospheric evaporation associated with a solar flare based on
this magnetic reconnection model.
Calculation Model
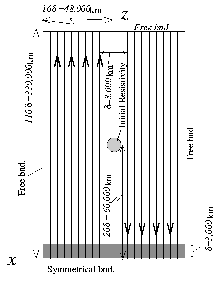 Fig.4
Fig.4
We solved two-dimensional MHD
equations without gravitation. The nonlinear anisotropic heat conduction effect
is taken into account. The initial condition (Fig.4) is in magnetohydrostatic
equilibrium with antiparallel magnetic fields in the xz-plane, between
which there is a current sheet. The initial gas consists of two layers: A hot
corona with density of 10^{9} cm^{-3} and with temperature of 2 \times 10^{6} K.
A low-temperature and dense region, whose density is 10^{5} times that of the
other area, is located near the x-axis. The plasma beta, the ratio of the
gas pressure to the magnetic pressure is taken to be \beta=0.2. So the magnetic
field strength is 6 G and the Alfven speed is 400 km s^{-1}.
We assumed an anomalous resitivity model (e.g. Yokoyama & Shibata 1994).
It increases with increasing drift velocity. The minimum magnetic Reynolds
number defined as Rm= Cs \delta/\eta_{max} is 3, where Cs
is the sound speed in the corona, \delta is the thickness of the current sheet,
and \eta_{max} is the maximum value of the resistivity.
In these conditions, the Alfven time defined by the initial thickness of the
current sheet divided by Alfven speed is 7 seconds and the heat conduction time
is 2 seconds. In the initial 1 miniutes, we imposed a resistivity perturbation
at this hatched region. Then magnetic reconnection starts at this point.
Results
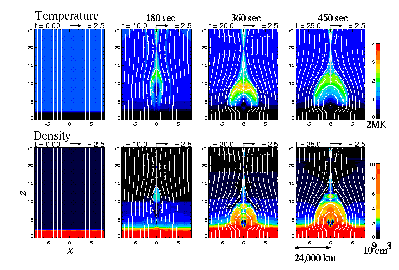 Fig.5
Fig.5  Movie.1
Fig. 5 and Movie 1 (left;
density, right; temperature) show the results. Because of the enhanced
resistivity, magnetic reconnection starts. The reconnected field lines together
with the frozen-in plasma are ejected from this X-point in both upward and
downward directions due to the tension force of the reconnected field lines. At
the boundary between the inflow and this outflow a slow-mode MHD shock is
formed.
At the same time, a heat condcution front propagates from the hot region
between the pair of shocks. The conduction of heat is only in the direction
along the magnetic field line. The outer edge of the conduction front,
therefore, traces the magnetic field lines extending from the X-point. This
temperature distribution is very similar to the cusp-like structure of solar
flare loops, which are observed by the soft X-ray telescope of Yohkoh satellite.
In the density distribution, a growing plasma mound can be seen. This is the
direct consequence of the so-called chromospheric evaporation. The chromospheric
plasma is heated up and expands suddenly due to the penetration of the heat
conduction front. The induced pressure-gradient drives a back-flow toward the
corona. This flow carries up the dense plasma into the corona.
 Fig.6
Fig.6
On the other hand, the
upward motion of the plasma driven by the tention force of the reconnected field
lines will be observed as a plasmoid ejection (Fig. 6) The velocity of ejection
is the Alfven speed, in this particular case 400 km/s.
`Observation' of the numerical flare
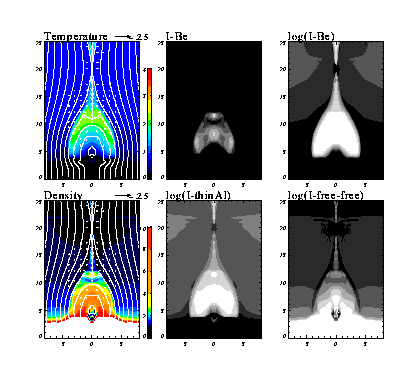 Fig.7
Fig.7
We derived soft X-ray (I-Be, I-thin Al) and radio (I free free) maps
from the simulation results (Fig. 7). This X-ray distribution is very similar to
the cusp-like structure of loops of a so-called long-duration-event (LDE) flare,
which are observed by the soft X-ray telescope of Yohkoh satellite.
T - B Scaling Law
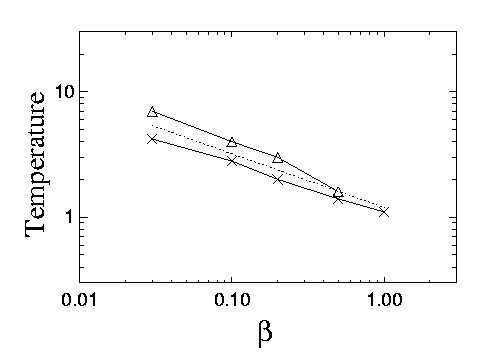 Fig.8
Fig.8
What determines the flare temperature and its distribution ? If we
assume that the input of energy to a loop balances with the conduction cooling
rate, the temperature at the loop apex is T \approx
(2QL^{2}/\kappa_{0})^{2/7} where Q is the volumetric heating rate,
L is the half-length of the loop (Fisher & Hawley 1990). In our
simulations, the heating mechanism is magnetic reconnection so that the heating
rate is described as Q=B^{2}/(4\pi) V_{in}/L
1/sin(\theta), where V_{in} is the inflow velocity (\approx 0.1
V_{A} from our result), and \theta is the angle between the slow-mode MHD
shock and the loop and is approximately given by sin(\theta)\approx
V_{in}/V_{A}. By manipulating these, we find

The simulation results in Fig. 8 show very good agreement with this scaling
law. When \beta=0.01 that is the typical value in the real solar corona, this
scaling law predicts the flare temperature T \approx 10 MK which is
consistent with the observed flare temperature T \approx 10-20 MK (e.g.
Tsuneta et al. 1992).
References
Fisher, G. H., & Hawley, S. L. (1990), ApJ,
357, 243
Neupert, W. M. (1968) ApJ, 153, L59
Tsuneta, S. et al. (1992) PASJ, 44, L63
Yokoyama, T.,
& Shibata, K. (1994), ApJ, 436, L197
Yokoyama, T., &
Shibata, K. (1997), ApJ, 474, L61
Yokoyama, T., & Shibata, K. (1998), ApJ, 494,
L113
produced by T. Yokoyama in 1998.
 Movie.1
 ![]() Fig.6
Fig.6  Fig.7
Fig.7
 Fig.8
Fig.8
