Database in Japan
Observation (SPACEW-J-OB0048)
Version 1.0 March 2004
(CAWSES database in Japan)
HILDCAAs in 1998
OB0048
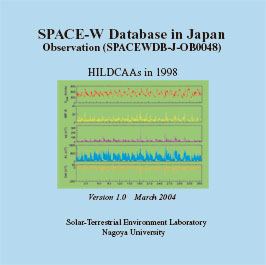
| SPACE-W (Space Weather International Collaborative Research) Database in Japan Observation (SPACEW-J-OB0048) Version 1.0 March 2004 (CAWSES database in Japan) HILDCAAs in 1998 |
OB0048 |
This CD-ROM contains 1-min. plots of solar wind and interplanetary magnetic field (IMF) data, ground magnetic, AU, AL, SYM, and ASY indices, high-energy proton fluxes at synchronous orbit for eight HILDCAA events in 1998, identified by the HILDCAA scientific group.
1. Introduction
HILDCAA stands for High-Intensity Long-Duration Continuous AE Activity, as defined by Tsurutani and Gonzalez (1987). HILDCAAs typically occur during the recovery phase of geomagnetic storms. The physical cause of HILDCAAs is not known, except that the mechanism creating HILDCAAs must be separated from that generating the main phase of geomagnetic storms since no available theories could account for a recovery of geomagnetic storms to last for several days, often for more than a week.
To understand what causes HILDCAAs from various viewpoints, an international team was set up to examine HILDCAA events: see
The team, led by B. T. Tsurutani and W. Gonzalez and Y. Kamide as one of 11 members, identified eight HILDCAA intervals in 1998, and these are classified into the following four categories:
Events Type 1 - HILDCAAs following geomagnetic storms:
11/March/1998, 04:40 to 17/March/1998, 14:50
24/April/1998, 21:25 to 29/April/1998, 06:05
Events Type 2 - HILDCAAs occurring before, along and after a storm (caused by a CME):
22/August/1998, 05:50 to 25/August/1998, 05:30 (1st phase)
28/August/1998, 03:35 to 01/September/1998, 06:25 (2nd phase)
Events Type 3 - HILDCAAs associated with a high-speed stream:
03/June/1998, 06:40 to 10/June/1998 , 15:15
21/July/1998, 02:20 to 25/July/1998, 18:50
Events Type 4 - HILDCAAs associated with a high speed stream occurring during the recovery phase of a geomagnetic storm:
07/May/1998, 21:40 to 12/May/1998, 14:30
20/October/1998, 15:55 to 25/October/1998, 20:20
2. Data Plots
These plots were developed as one-day data plots for the HILDCAA events identified by the team. Data obtained by the ACE spacecraft, the ground magnetic field, and four LANL geosynchronous satellites are plotted.
From top, (1) interplanetary magnetic field (magnitude, and the x, y, z components), (2) proton density, bulk speed of the solar wind, (3) magnetic field activity (as described by the AU, AL, SYM, ASY indices), and (4) proton differential fluxes [particles/cm2/second/steradian/keV] are shown. In proton differential fluxes plots, six lines represent the variations in different energy bands (50 ? 75, 75 ? 113, 113 ? 170, 170 ? 250, 250 ? 400, and 400 ? 670 keV). ・ is the time when the satellite was at 12 LT, whereas ・ is the time when the satellite was at 0 LT.
Acknowledgements:
We thank the HILDCAAs team for their close collaboration. The calculation reported here was supported by the Center of Excellence (COE) program under the auspices of the Ministry of Education, Science, Sports and Culture of Japan. We would like to thank K. Yago and Y. Kadowaki for their able assistance in preparing the plots.
References:
Tsurutani, B. T., and W. Gonzalez, The cause of high-intensity long-duration continuous AE activity (HILDCAAs): Interplanetary Alfven wave trains, Planet. Space Sci., 35, 405, 1987.
CONTACT:
Prof. Yohsuke Kamide
Solar-Terrestrial Environment Laboratory
Nagoya University
3-13 Honohara, Toyokawa 442-8507, Japan
TEL: +81-533-89-5183
FAX: +81-533-89-0409
E-mail: kamide[AT]stelab.nagoya-u.ac.jp