[Japanese/ English]
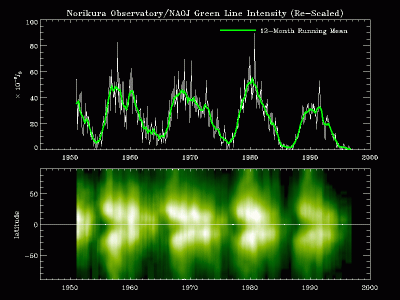 |
The intensity of the coronal green emission
line varies roughly in phase with the sunspot number. Therefore, the latitude
distribution of the green line intensity shows a diagram similar to the
sunspot butterfly diagram. A difference is seen in high latitude regions,
where no sunspots are seen but the coronal emission exists and migrates
toward the poles. At the sunspot minimum, the polar regions are dark because
of large coronal holes there. |
|
|
|
|
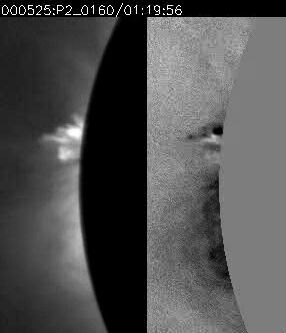
A limb flare observed by the NOGIS instrument (NOrikura Green line Imaging System). The left panel shows the intensity of the coronal green line (representing a 2MK plasma in the corona), and the right panel shows the Doppler shift of the line. In association with the flare, multiple bright loops are created successively and conspicuous plasma flows were observed. A large-scale propagating disturbance is also noticed prior to the flare onset. |
|
|
|
|
|
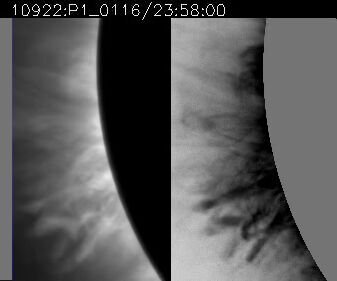
A wave-like phenomenon in the corona observed by the NOGIS instrument. The left panel shows the intensity of the green line, and the right panel shows the Doppler shift of the line. A propagating disturbance is noticed in the last few frames of the velocity data, while it is not recognized in the intensity data. NOGIS has observed such disturbances in the corona frequently in the Doppler shift images. |
|
|
|
|
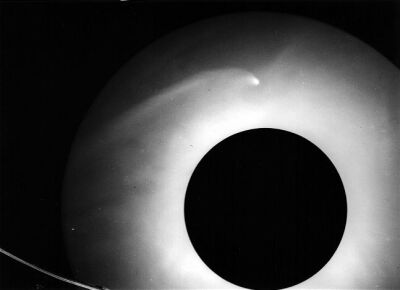 |
Comet Ikeya-Seki photographed with the 10cm coronagraph (1965 October). |