[Japanese/English]
|
[Results of Sunspot
Observation]
|
|
|
Sunspot Relative Numbers
|
|
 |
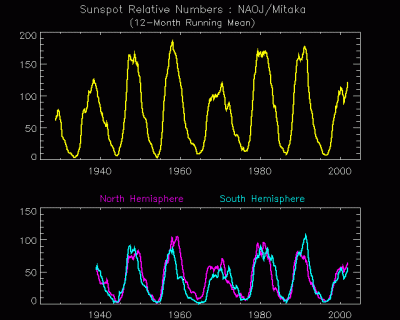
The number of sunspots varies with a period of about 11 years. However, the amplitude of the cycle is not always the same, and a long-term variability is superposed on the 11-year cycle. The activity levels of the northern and the southern hemispheres are not identical, and the dominant hemisphere of the activity varies with time. |
|
|
|
| Butterfly Diagram of Sunspots | |
 |
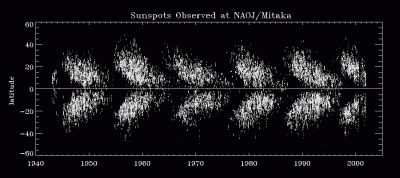
The latitude distribution of sunspots, when plotted as a function of time,
shows a pattern of butterflies (the butterfly diagram). At the beginning
of an activity cycle, sunspots appear at mid-latitudes (30-40 deg), and
as the cycle progresses, the sunspot belt migrates toward lower latitudes.
At the end of the cycle, sunspots are seen near the equator. |
|
|
|
| Active Region Faculae and Polar Faculae | |
 |
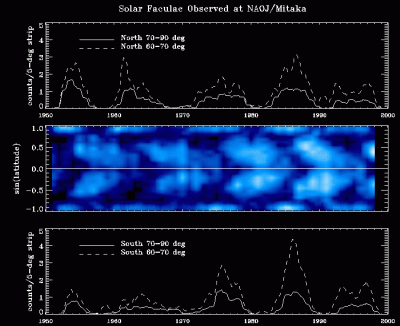
Faculae are small bright patches
seen around sunspots. Their latitude distribution is similar to sunspots,
and leads to the butterfly diagram when plotted as a function of time.
There is, however, another kind of faculae which appear in the polar regions
where no sunspots exist. These faculae are called 'polar faculae.' The
polar faculae are most numerous at the minimum of sunspot activity. |